


Customer Credentials
The customer is a leading North American specialty vehicle manufacturer specializing in the design and production of emergency response vehicles built on multiple commercial truck chassis platforms. With a diverse customer base across public safety, healthcare, and emergency services, the company offers a wide range of vehicle variants tailored to specific operational requirements.
Each specialty vehicle program begins with selecting the appropriate truck chassis, followed by configuring the vehicle body, sub-assemblies, and associated engineering components. Over several years, the customer had accumulated extensive historical sales, engineering, and production data covering hundreds of vehicle configurations across multiple truck platforms.
Although this information existed within the organization, it remained scattered across spreadsheets, engineering records, and project files. As the number of truck platforms, customer preferences, and product variants increased, accessing meaningful insights became increasingly difficult.
MN Engineering Solutions (MNES) partnered with the customer to transform years of disconnected data into an integrated configuration intelligence platform that would support sales, engineering, procurement, and management teams throughout the vehicle development lifecycle.
Situation / Challenge
Selecting the right truck platform is one of the earliest and most critical decisions in specialty vehicle manufacturing. That single decision influences engineering design, component selection, procurement planning, production scheduling, project cost, and delivery timelines. However, the customer's existing process relied heavily on manual knowledge, historical experience, and multiple disconnected data sources.
 Truck Platform Selection
  Manual Data Review
  Disconnected Sources
  Assembly Identification
  Design Reuse Difficulty
  Communication Gaps
 Sales engineers frequently needed to answer questions such as which truck platform best fits a customer's application, which chassis configurations are most commonly selected, what wheelbase options are available, which models have historically performed well, and which truck platforms are becoming less popular. Finding accurate answers required manually reviewing historical project records.
Once a truck was selected, engineering teams faced another challenge. They had to determine which assemblies belonged to that truck, which standard parts were required, which optional sub-assemblies were applicable, and what existing engineering designs could be reused. This information was often spread across multiple engineering folders and design databases, requiring engineers to spend considerable time locating the correct data.
The lack of a centralized configuration system also created communication gaps between departments. Sales teams discussed customer requirements, engineering interpreted those requirements, procurement identified parts, and production planned manufacturing. Since each department often relied on different information sources, inconsistencies occasionally emerged during project execution. The organization recognized that the issue was no longer simply about data availability—it was about making that data accessible, visual, and actionable.
The organization recognized that the issue was no longer simply about data availability—it was about making that data accessible, visual, and actionable.
Implications
The fragmented approach affected multiple business functions.

Sales Challenges
Sales teams required quick and reliable answers during customer discussions. Without consolidated historical insights, selecting an appropriate truck platform often depended on individual experience rather than data-driven recommendations.
This resulted in longer customer discussions, slower quotation preparation, increased engineering dependency, and limited visibility into historical sales trends.

Engineering Challenges
Engineering teams spent significant time searching for existing assemblies and components after a truck was finalized.
The absence of visual configuration reference increased effort in locating standard assemblies, identifying reusable designs, verifying applicable components, and coordinating with other departments.

Cross-Functional Communication
Because each department worked with different datasets, communication gaps occasionally developed between Sales, Engineering, Procurement, Production, and Project Management.
Information was often transferred manually, increasing the possibility of inconsistencies and delays.

Limited Business Visibility
Despite possessing nearly five years of valuable operational data, the organization lacked a centralized mechanism to analyze trends such as best-selling truck platforms, seasonal demand patterns, frequently selected configurations, customer buying preferences, low-volume vehicle variants, and emerging market trends.
These insights could have significantly improved business planning and strategic decision-making.
Solution Implemented by MNES
Rather than simply organizing historical records, MNES developed an integrated configuration intelligence platform that combined data analytics, visual dashboards, engineering configuration, and cross-functional collaboration into a single decision-support ecosystem.
Historical Data Analytics & Dashboards
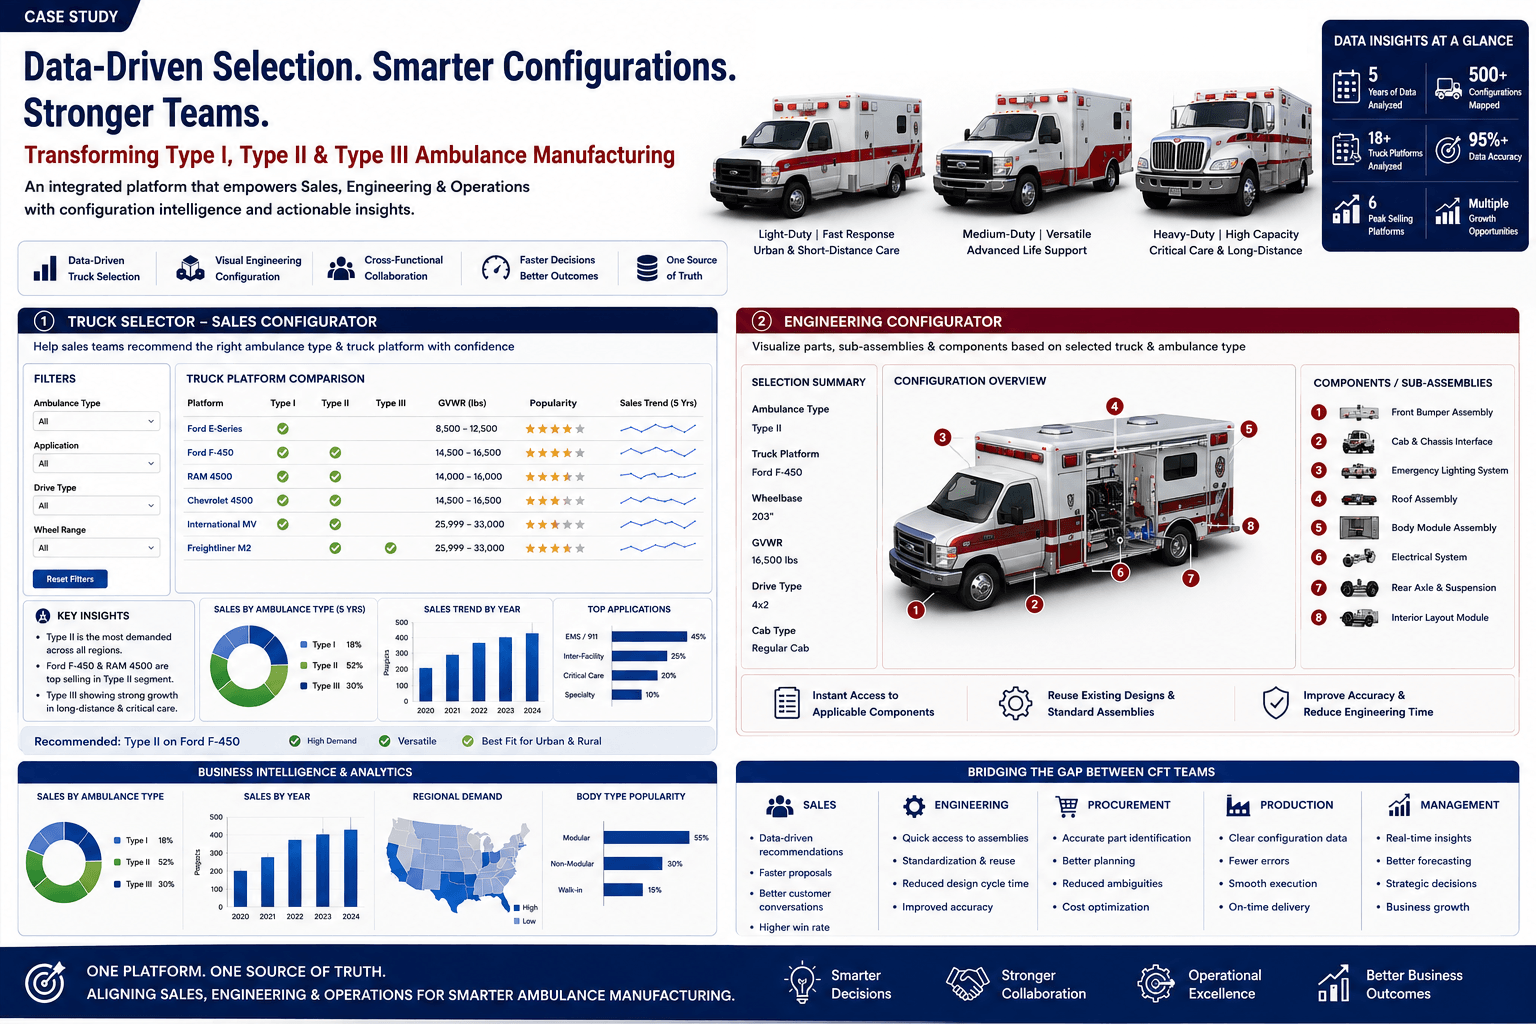
The first phase involved studying nearly five years of historical project data. The information was analyzed to identify frequently selected truck platforms, sales volume by vehicle type, customer purchasing patterns, platform popularity trends, configuration frequency, seasonal sales behavior, and product utilization trends.
Instead of static reports, these insights were converted into interactive dashboards that enabled stakeholders to explore business performance from multiple perspectives.
Intelligent Truck Selection Dashboard
MNES then developed an interactive Truck Selection Dashboard. Instead of manually searching historical records, sales teams could now filter and compare truck platforms based on multiple technical and commercial parameters.
The dashboard enabled users to compare available truck platforms, view compatible configurations, explore historical usage, understand platform popularity, and support customer discussions with data-backed recommendations.
Engineering Configuration Dashboard
Once a truck platform was selected, engineering teams could seamlessly transition into an Engineering Configuration Dashboard. The dashboard visually presented standard assemblies, sub-assemblies, vehicle components, and platform-specific configurations. Rather than navigating through numerous engineering folders, designers could immediately visualize the parts associated with the selected truck platform. The image-based configuration interface significantly improved design understanding and accelerated engineering activities.
Bridging Cross-Functional Teams

For Sales Teams
Sales could recommend truck platforms using historical insights, improving customer confidence.

For Engineering Teams
Engineering could instantly identify applicable assemblies, reducing search time.

For Procurement Teams
Procurement gained visibility into standard components, improving sourcing consistency.

For Production & Management
Production received consistent configuration information using a single source of truth.
Outcome
The implementation delivered measurable improvements across both operational efficiency and business decision-making.
Quantitative Improvements
The solution enabled:
- Faster truck platform selection
- Reduced engineering search time for assemblies and components
- Improved reuse of standard engineering designs
- Faster quotation preparation
- Improved accessibility of historical business data
- Better visibility into sales trends and product utilization
- Reduced manual effort in configuration management
Qualitative Improvements
Data-Driven Sales Decisions
Sales teams could confidently recommend truck platforms supported by historical trends instead of relying solely on experience.
Faster Engineering Configuration
Engineers gained immediate visibility into platform-specific assemblies, reducing time spent searching for reference models.
Improved Cross-Functional Collaboration
The shared dashboard established a common language between Sales, Engineering, Procurement, Production, and Project Management.
Enhanced Business Intelligence
Leadership gained valuable insights into historical business performance, enabling proactive planning based on actual customer demand.
Conclusion
This project demonstrated that the true value of engineering data lies not in how much information an organization possesses, but in how effectively that information can be transformed into actionable intelligence.
By integrating historical analytics, intelligent truck selection, visual engineering configuration, and centralized dashboards into a unified platform, MNES helped the customer bridge the gap between Sales, Engineering, Procurement, Production, and Project Management.
The solution not only accelerated engineering workflows and improved customer engagement but also established a shared decision-making framework across the organization.